Progress and Analytics
Every lesson a member completes writes a row, every module and course keeps a running summary, and the admin screens read those tables. Nothing here needs configuration; this page explains what the numbers mean and where to find them.
How progress is calculated
Course progress is duration-weighted. Each lesson contributes its duration to the course total, and completing it contributes the same amount to the member's progress. A member who finishes the two long lessons of a three-lesson course can sit at 80 percent, not 66, because the short lesson weighs less.
Durations come from the minutes you set per lesson. A lesson with no duration set counts as 15 minutes. A course's total duration is the sum of its lessons' durations, which means it also inherits that default, so displayed totals can differ from what you typed into the course settings box. The fix is the same in both places: set durations on lessons.
Progress only counts published lessons, so drafts and trashed lessons never distort a member's percentage. Completing a lesson records a timestamp, and the summary keeps the last-activity time, which is what the Students screen sorts by.
The Students screen
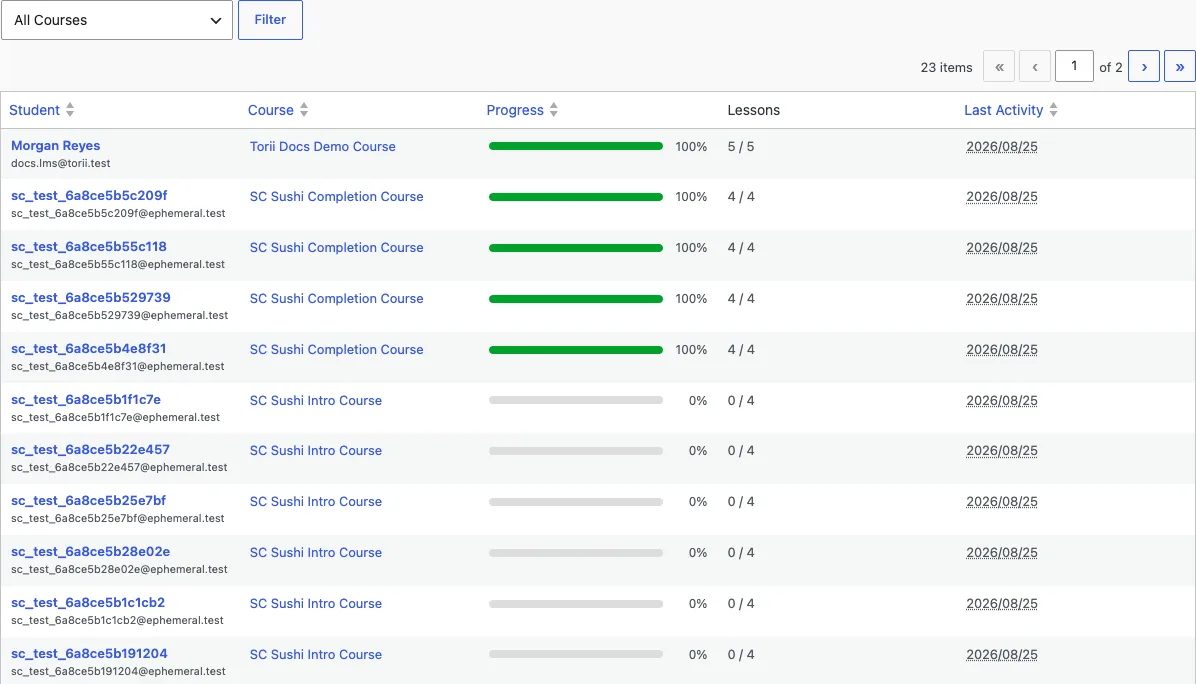
Sushi LMS > Students lists one row per member per enrolled course: their progress percentage, lessons completed, total, and last activity. Filter by course to see a cohort at a glance, and export the view to CSV for reporting outside WordPress. Instructors see only students in their own courses.
The Analytics screen
Sushi LMS > Analytics has three tabs:
- Overview covers the whole site: enrollment counts over time, completions, average quiz scores, and the most active courses. The enrollment chart doubles as a health check for a launch: a spike with no completions two weeks later is a retention signal, not a sales signal.
- Quiz Analytics breaks down each quiz question: how often each answer was chosen, and which questions members get wrong most. A question most members miss is either a hard question or a badly written one; the answer distribution usually tells you which.
- Course Detail picks one course and shows where members stall: the lessons with the most in-progress starts and fewest completions.
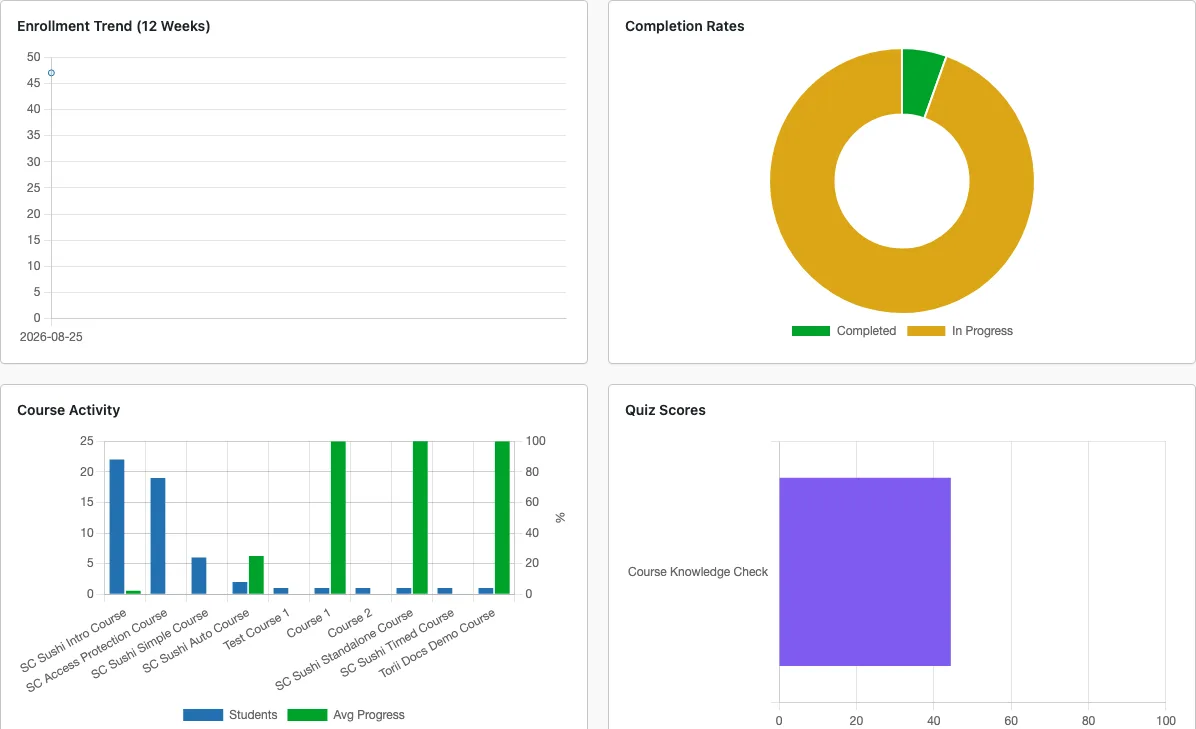
The WordPress dashboard also carries an LMS Overview widget with course counts, enrollments this week, completions, and average quiz score.
Progress on the member side
Members see their own progress through the shortcodes, on course pages, or anywhere you place them:
[memb_lms_course_progress]renders the progress bar, optionally with a label and a completed-over-total count.[memb_lms_course_outline]renders the full course tree with per-lesson state: completed, in progress, or locked with a date.[memb_lms_resume]renders a button back to the member's last unfinished lesson. At 100 percent it becomes a link to the certificate.[memb_lms_my_courses]renders the member's course list, each card carrying its progress bar and resume link.
Course and lesson pages inject the same elements automatically: a progress bar and resume button at the top of a course, mark-complete and prev/next navigation on a lesson.
Two behaviors surprise people the first time. Uncompleting a lesson, by the member's own uncomplete button or from the admin, recalculates course and module completion downward, so progress is always live data, never a stored opinion. And members who lose access to a course keep their progress rows; if they regain access later, they resume where they stopped, which is what makes re-enrollment after a lapse painless.